Sunday 26 October 2014

The Market Dips

In my last post back in September, I mentioned the fact that some commentators were saying that market was due a 10% correction. I argued that a pull-back in stocks seemed unlikely because it is perhaps one of the few asset classes left able to deliver real return. Given the market rollercoaster over the last month perhaps I should give up making predictions!

On the other hand I was not entirely wrong. Although there was a whiff of panic in the markets, there was no obvious cause. The papers have been full of headlines on Ebola, but the broader geo-political and economic picture seem relatively unchanged. What's more, the FTSE 100 correction from peak to trough was barely 10% before it staged a 3% recovery last week. I am sure that many sellers have asked themselves what they should do now with their new found cash and decided to buy back in. This market blip seems to be just one of those things that happens from time to time.

With this dip in the market I made the decision to go all in with this year's Stocks and Shares ISA allowance, so I had a  busy time this week topping up my portfolio. I am now 80% in equities, which is as far as I want to go until the next lurch downwards.

Portfolio Update

The Mechnical Bull portfolio held up pretty well during this correction (See chart below). Indeed it is already back at the level it was a month ago. Cohort (CHRT) has provided the strongest support for the portfolio over the past month increasing 20% followed by Pace (PIC) which has bounced back 12% following an extended decline.


There was a change in the MB porfolio on 17 October. The MB score for Harvey Nash (HVN) dropped below 80 and so was sold at 88p for a small profit of 3.4%. This was disappointing given that the share price touched 125p in May. It was replaced by Cenkos (CNKS) which was scoring 104. Despite a Momentum score of 96, Cenkos is down 20% over the month.


What Works on Wall Street

I have been reading James O'Shaugnessy's classic, "What Works on Wall St". I am already familiar with his ideas, but this is the first time I've gone directly to the source. In terms of his broad philosophy he is preaching to the converted although there a couple of things that he mentions that have given me pause for thought, particularly around managing risk.

The overarching message of O'Shaugnessy's book is  the importance of looking at what works over long time periods (i.e. over 50 years). Its good to be reminded of this when short-term events, like this months market dip consume our attention.

Sunday 14 September 2014

Under-performance and Fraud stocks

In this post I expand on some earlier ideas  on the under performance of Stockopedia's guru screens and some related thoughts around so called "fraudulent stocks".


Under-performance of Screening Strategies


The last six months has been hard going for rules based investors. Just take a look at Stockopedia's "style" performances against the FTSE 100 index. These are composite strategies based on subsets of Stockopedia's 66 guru screens:


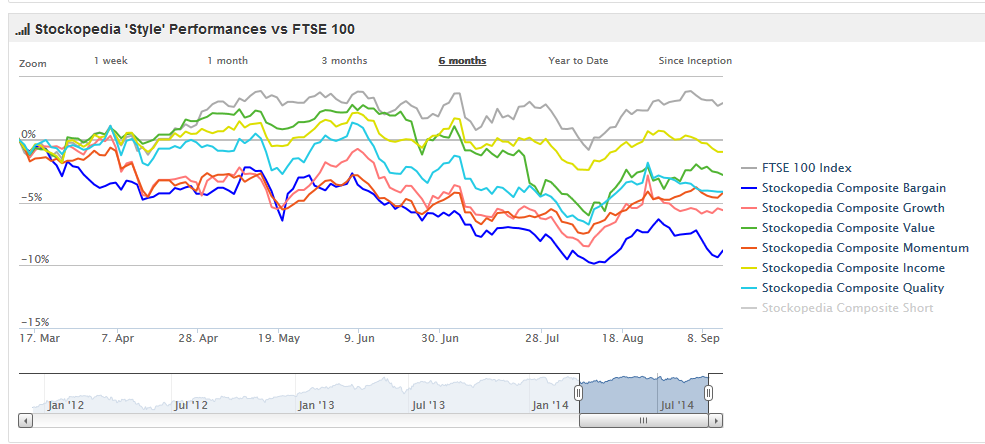
While the FTSE 100 increased by 2.9 percent in the last 6 months, all investment styles lost ground. Of the individual screens making up each up these composites, only nine out of 60 (long screens) beat the FTSE 100. The "Screen of screens" is a composite strategy flagging up stocks appearing in multiple screens. It is down 5.2 per cent over the last six months, about the same as  the Mechanical Bull portfolio. As I've discussed in a previous post, these composite indices have tended to track the FTSE 250, which has pulled back about 5 per cent since it peaked at the end of February.

My take is that the FTSE 100 is increasingly acting as a refuge for when financial markets enter a  'risk off' phase. During these times capital normally flows out of equities and into bonds. However, with the returns from gilts and corporate bonds so pitiful, money is instead flowing into defensive large caps paying consistent dividends. These are essentially stocks with bond-like characteristics.

It is worth noting from the above chart that income strategies have  performed best over the last six months. Tobacco, oil, pharmaceuticals and utilities have all done rather well. Income based strategies would have done even better if it weren't for the recent dire performance of Morrisons and Tesco, which have been worst performing FTSE 100 stocks over the past six months.

This idea of the FTSE 100's emerging role as a safe haven is supported by the observation that it seems to be reacting less strongly to geopolitical events. Rapidly deteriorating relations between Russia and West and even the prospect of Scotland leaving the UK have barely made a dent. The FTSE 100 has just been moving sideways in a fairly narrow band while the FTSE 250 has been drifting down.

Some commentators seem to think that the market is due for a 10% pull-back. However, I think it will take something pretty major to shake investor confidence. A vote for Scottish independence would do it, although I think this is unlikely.

So basically, the last six months have been "risk off" with a net flow of capital from small and mid caps to large caps. Further, this under-performance of most screening strategies has to be seen in this context and not as fundamental failure of these approaches. These strategies should go on and outperform when the market goes risk-on again.

For me, the overriding question is, where else are investors supposed to put their money? I recently got a letter from my bank telling me that they had made the "difficult decision" to reduce the rate on my savings account from 1.3% to 0.9%. I have been keeping a chunk of my savings as a war chest for the next pullback. But this means I am now losing even more money in real terms and what if my new thesis is right and a stockmarket pullback doesn't come? Putting money into defensive dividend paying stocks rather than bonds during this "risk off" phase would seem to be a  sensible strategy and perhaps, the market has already worked this out.


Mechanical Investing and "Fraudulent Stocks"


I will start off here with a disclaimer that I am not asserting that any of the stocks mentioned in this section are necessarily fraudulent stocks. I do not have the relevant expertise to make these judgements. However, other commentators have made these kind of assertions and so I am referring to the risk that these stocks could be fraudulent.

Naibu Global International (NBU) is a Chinese AIM-listed shoe manufacturer, which released its "unaudited" interim results on Friday. For seasoned investors, the words "Chinese" and "AIM-listed" are virtually synonymous with fraud. Naibu currently has a  PE ratio of less than 1, so if it isn't a fraud, then it is the bargain of the century.

The company announced the suspension of dividend payments, supposedly to fund construction of a new factory. However, as the dividend was the one thing giving Naibu some semblance of credibility, investor confidence evaporated and the dropped over 40% in one day. Paul Scott gives a fuller commentary on his Small Cap Report. There is an interesting clip from the UK Investor show back in April where Lucien Miers tells of meeting a Chinese student who not only hailed from the same city where Naibu is based, but also had family connections within the shoe industry. The student had never heard of Naibu!

I don't have a position on Naibu. However, I am very interested in it because my rules based system came very close to flagging it up for purchase earlier in the year. Indeed, even now, it pops up in an incredible 13 Stockopedia guru screens. Perhaps this partly explains why Stockopedia's Screen of screens has been underperforming of late.

In any case, this highlights one of the inherent risks of mechanical based investing systems. It is not easy to design a system that filters out companies producing fraudulent accounts. There are some well known "red flags" that may be indicative of aggressive accounting practices. These include growing reported earnings but negative operating cash flow and the Beneish M-Score which aims to measure risk of earnings manipulation. However, the later is a probability measure that can produce false positives. One of my most profitable investments over the last 18 months was Kentz, which I almost bailed out of at a loss because of a just such a red flag. Of course, an "unaudited" set of accounts could be a complete work of fiction in which case the any red flags would be qualitative in nature and impossible to incorporate into a mechanical based strategy.

Early last year I bought Globo as it had being flagged up on a large number of Stockopedia screens. Globo is not a China-based stock, but it is on AIM and anyone following Globo will be aware that it is another controversial stock. It was also subject to a bear raid towards the end of last year. Fortunately, I timed my exit pretty well and I managed to secure healthy 46% profit. However, this was almost certainly down to luck rather than any skill on my part.

The problem is that "strategic ignorance" is a cornerstone of my investment philosophy. Joel Greenblatt is his book the "Little Book that Beats the Market" urges investors to "trust the quant" and select stocks at random that meet the investment criteria. He argues that the ugliest looking stocks will often deliver the best returns and that investors trying to apply their own judgement will just sucked into systematically making the wrong decisions.

However, I  suspect that Joel Greenblatt developed these ideas well before dodgy Chinese stocks started popping up in Western stockmarkets. Stockopedia's screen based on Greenblatt's Magic Formula has performed poorly over the past 2 to 3 years. It has performed especially badly over the last six months, falling over 13%. This is hardly surprising given it has been flagging up the likes of Quindell (another highly controversial stock) which has dropped around 70% over the past 6 months.

The point here is that a purely mechanical based investment approach involves inherent risk. If you do not undertake due diligence, you risk buying into a company that may be fraudulent. I don't think it is possible to eliminate this risk, but for my part, I will be tweaking my investment rules again to filter out any Chinese based Aim stocks. Fortunately, the Mechanical Bull portfolio has so far managed to avoid any complete disasters. Hopefully I can minimize them in future.


Monday 1 September 2014

Mechanical Bull Portfolio - August Review

The Mechanical Bull portfolio increased by 3.3% over the month. This compares with 1.3% for the FTSE 100 and 2.5% for the FTSE 250. This continued the trend of the last six months where the portfolio has been tracking the main indices. Renew was the standout performer gaining 22 per cent.

It was a busy month with VP, Dart and Staffline being sold and replaced by Amec, Wincanton and James Latham.

Dart Group was sold at 208p on the 11 August for a small profit of 4.5%. This was very disappointing considering the share price topped out at over 300p in April. The Stockopedia StockRank had dropped in to the 80s and it was only coming up in one Stockopedia screen and so according to my rules it had to go. It was replaced by Wincanton, which had a MB score of 105 (100 StockRank, + 5 Screens).

VP was also sold on the 11 August at 635p for a loss of 6.5%. This was bought in January this year has more or less just moved sideways. The StockRank dipped into the 80s with just one Stockopedia screen. It was replaced by Amec, which had a MB score of 103 (96 StockRank + 7 screens).

Things went much better with Staffline, which was sold on 29 August for 880p, more than double the buy price. Staffline's StockRank dropped sharply in the last week of August, down into the mid-70s. In fact, Staffline was the worst performing stock during August and I would have got 100p more if this had been sold one month earlier. The profits were used to purchase a stake in James Latham which has a MB score of 103 (98 StockRank score + 1 screens).

When buying into a new stock I select a position size by dividing the entire value of the portfolio by fifteen, which is the number of stocks held in the portfolio. However, since I don't bother with rebalancing, there isn't always enough cash achieve the desired position. This happened earlier in the month when buying into Wincanton and Amec, and so those positions had to be scaled back.

However the returns from the sale of Staffline means the portfolio now has larger than normal cash balance (£1300). I've decided to just hold this in cash to provide a bit of a buffer for when the cash from a sale does not cover the desired position size for the incoming stock.

So here is how the MB Portfolio looks as at the end of August:


A Tweak of the Rules

I have said before that I have not really convinced about the MB portfolio sell rules and in real life I have not been keeping to them. Dart seems oversold and it is now showing some signs of recovery. It also has a very good QV rank of 97.  However, profits have been taken in Staffline. It seems to have run out of steam and it has a fairly unimpressive QV rank of 48.

Its time then to tweak the buy/sell rules. Instead of selling when the MB score falls under 90, I am lowering automatic sell threshold to 80. But I will also implementing an automatic buy rule when a stock hits 105. These buys would be funded by selling the lowest scoring stock at the time.

Going back through my old spreadsheet suggests that this would have allowed me to run profits longer with WH Smith and Jarvis Securities while I would have avoided some of my less successful investments like Alumasc and Aberdeen Asset Management. Also, it would have allowed me to keep Dart which is now entering a recovery phase.

Overall, it wouldn't have a huge difference in performance, but its enough to warrant a change.


Thursday 21 August 2014

A Stock Ranking Backtest

The Mechanical Bull method is a strategy based on theory. The logic is appealing, and it has performed reasonably well over the last 15 months. However, I have had no real way of testing how well it is going to perform over the long term. I would love to be able to backtest the approach. Unfortunately, this is not possible because Stockopedia doesn't provide a backtesting service (at least not yet).

Recently, I made a rather intriguing discovery. I used to be a frequent user of Sharelock Holmes, until Stockopedia launched its subscription service. Over the weekend, I dipped back into the site and stumbled over some new metrics that looked remarkably like Stockopedia's ranking measures. Sharelock now has composite Quality, Momentum and Value scores, as well as the various blended composites, including the "Market Score" which is their version of the StockRank. It uses a similar ranking score from 1 to 100 (although 1 is the best through to 100 for the worst).

Now, I am certainly not advising anyone to cancel their Stockopedia subscriptions and switch to Sherlock Holmes. It is a rather dull and drab website and the screening functionality is fairly limited. More importantly, I suspect the data is not always up to scratch. I've come across errors in the past relation to handling of share splits. However, the one area where it exceeds the Stockpedia offer is in terms of backtesting. So I feel this provides a useful opportunity to see how these composite strategies play out over the longer term.

It is important to note that these Sharelock Holmes rankings do not produce the same set of stocks as the Stockopedia ranking system. Of the current StockRank top decile stocks, about 60 per cent are in the top decile "Market Score" list. Most of the remainder rank are in the second decile although a few got very poor scores.

So these rankings seem to be based on very similar principles, but the implementation differs. There are also clearly differences with some of the data. Just one example I picked out was the Piotroski score for Staffline, which is 8 according to Stockopedia but just 4 according to Sharelock. Not with standing these differences some back testing of these ranking scores seemed too me to be a worthwhile project.

This first chart shows "Market Score" performance by deciles (rebalanced each quarter) going back to Jun 2003:

This gives the familiar and reassuring fanning out pattern seen on the Stockopedia discussion forums, except going all the way back to mid-2003. The top decile stocks blitz the field with an especially impressive performance over the past 5 years. The chart also nicely illustrates the compounding effect over the longer term. This just goes to show how tilting the odds in your favour, even just slightly, can deliver very impressive returns over the longer term.

However, it is also interesting to note that that all deciles fall away during the bear market that started in mid-2007 through to early 2009. I think this raises some interesting questions about market psychology. It seems that the market as a whole acts fairly rationally during bull markets, identifying quality, undervalued and winning stocks and dumping junk, expensive and losing stocks. However, during a bear market, fear takes over and investors seem to be willing to irrationally dump stocks irrespective of fundamentals. So, really, we should be grateful for bear markets since they generate the fertile ground for rational investors to exploit in the next bull run.

My next piece of analysis involved selecting the top decile stocks for Quality, Value and Momentum, along with all the composites (QV, QM, VM, "Market Score"). For each strategy I generated a set of relative performance data for every quarter back to June 2003 for a range of time periods from 3 months to 5 years. For each of these time periods I have then averaged the performance and then annualised the data. For example, for performance data over two years, I halved the average performance to give a figure that could be compared with all the other time periods.

It is only possible to compare the performance across all these various time scales on a fully like for like basis for the first five years (i.e. Jun 2003 to Jun 2009). In other words, to get the 5 year performance results for June 2014, you would have to wait until June 2019 to see how those stocks will eventually perform. So it is important to bear in mind that this data does not include the bull market of the past five years (and also remember this is relative not absolute performance). The results of this comparison is shown below:


This shows that momentum over the short term is is the single most effective strategy. However, performance drops of quickly after 3-6 months so in terms of translating this into an effective strategy you would need to factor in trading costs and spreads etc. Also, momentum tends to do badly in falling markets.

A strategy based on a pure value rank performed worse of all. This result seems pretty surprising considering that value investing is so widely respected. A likely explanation is that a rules based approach to value investing may be susceptible to picking value traps, that is, stocks that are a cheap, but for very good reasons that doesn't appear in the financial data. The only time that a value based rules strategy seems to really pays-off is after the market has completely tanked.

A strategy based purely on quality does consistently well over all time periods. Quality also holds up  best when the market is under pressure. This suggests that quality stocks are not just for buy and hold type investors, but should probably be key consideration for any investment strategy.

The combined QVM (Market) strategy does fairly well but it doesn't particularly stand out as the best approach. I suspect the under performance of value acts as a slight drag its overall performance. On this basis, the greater safety offered by quality would seem to be a price worth paying for only slightly greater short-term returns.

I also produced another version for the full ten years. As explained above, this shows only partial data for the longer time periods, but it is worth showing as it incorporates the bull market since early 2009.


This shows that the returns for both the Market and QM strategies have picked up relative to pure quality. If one considers that the typical holding period for a stock in the MB portfolio is about a year, then either of these strategies would offer at least a 10 percent annual return above the market.

There is a lot more I would like to look at here, but something I am starting to think about is a strategy based on different phases of the stockmarket cycle. This could consist of quality, value and momentum "pots" where the size of the pots would vary according to the state of the market. For example, given where we are at the moment I might have about 70% quality and 30% momentum stocks. If the market drifts down I might go 70% quality 30% value. If another bull market I might go 50% quality and 50% momentum.

Anyway, lots of ideas here and lots more thinking to do.

Friday 8 August 2014

A Riddle Solved

I regularly check out the very slick dashboard on Stockopedia's home page. I've been a particular fan of the Guru Screens section. This includes a Guru index, which is a composite of all 60 or so long guru screens maintained by Stockopedia.

Over the past few months I have been increasingly puzzled by the droopy looking shape of the Guru composite index versus the FTSE 100 index. I've replicated the chart below to show you what I mean:


This shows the composite Guru index steadily pulling away from the FTSE 100, accelerating away during the second half of 2013 but then falling back over the last six months or so. In contrast,the FTSE 100 has been holding its ground pretty well during 2014.

Stockopedia handily group Guru screens by 'style performance' (e.g. Value, Growth, Momentum, Income etc.) so you can dive a bit more into the detail (although this is subscriber only service). Unfortunately, this doesn't really shed much light on proceedings. The FTSE 100 outperforms every one of these style indices over the past six months. In other words, whatever you investment style, you have probably lost money over the past six months. Unless of course your guru is a monkey with a pin and a list of FTSE 100 companies. In that case, you are probably slightly ahead.

This seemed to me to be a very strange state of affairs and so I decided to really put in some effort to work out what is going on. I spent a lot of time stratifying performance data and looking for patterns, After a number of false leads, I stumbled over something very interesting. It turns out I was looking in the wrong place. I should have been looking into the benchmark rather than performance factors of the guru screens. I will just cut to the chase and show you what happens when you overlay the FTSE 250 index over the composite Guru screens:


This clearly shows that the Guru composite index has been basically tracking the FTSE 250 over this period. Of course, a lot of FTSE 250 stocks appear in these Guru screens. I have done some rough calculations (rough as there isn't a straightforward way of screening out FTSE 250 stocks on Stockopedia) and I reckon about 30 per cent of all Guru screen appearances are FTSE 250 stocks. In contrast, less than 10 per cent of appearances are for FTSE 100 stocks. Even so, the strength of the correlation between the Guru index and the FTSE 250 seems remarkable.

What this shows is that if you really want to test whether a strategy is outperforming, you need an appropriate benchmark. Ideally you want a benchmark that broadly represents the investment universe your picking from so you can determine whether you can identify stocks that systematically outperform. The FTSE 100 Index isn't ideal in this case because it represents such a small part of the investment universe from where the Guru strategies are drawn.

There is the FTSE All share index, but that just seems to follow the FTSE 100 pretty closely, so I assume that the index is weighted by market cap. What you really want is an unweighted index of all FTSE and AIM stocks, but I am not sure if there is such a thing. If anyone knows something about these things please let me know!

This also throws up the obvious question as to whether these guru screens actually help in picking winning stocks. The evidence above suggests that using the monkey with a pin method on FTE250 stocks might work just as well.

I have said before that stock screening has its limitations because it is binary blunt instrument. Stocks are either in or out and there is no differentiation between a stock that clears a hurdle by a country mile and ones that just scrape in. The same principle applies for those that just miss out. I also have a pet theory that stock screening tools have become so widely available that perhaps they no longer give the average investor much of a edge.

These things aside, I am pleased to have solved this riddle. When I see different markets moving in certain ways, I am always trying to work out where the money in the system is going from and going to. The pattern over the last six months clearly points to a net move of capital from smaller to large caps.

Portfolio update:

The MB portfolio was down 1.3 per cent in July. This pretty much followed the major indices, with the FTSE 100 falling about 0.2 per cent and the FTSE 250 down 1.4 per cent. The was one change to the portfolio with Sweett (CSG) making me reach for on 8 July to be replaced by Castings (CGS). So that was CGS replacing CSG, which has a nice symmetery about it.

Thursday 3 July 2014

Mechanical Bull Portfolio - June Review

Down 3.7 over the month


There is no disguising it. June was a dire month for the MB portfolio. It was down 3.7 per cent over the month. This compares with a 1.7 drop for the FTSE 100 and a 2.2 per cent decline for the FTSE 250.

Dart Group mainly to blame


The biggest loser was Dart Group. It was down by more than a quarter over the month. At one point it was below 180p although it bounced back to 205p by the end of June.

This fall was triggered by a rather downbeat trading update. What was interesting for me was the widely different reactions from different quarters. Comments on Stockopedia were mostly (although not entirely) negative. A number of comments focused on concerns not at all linked to the update, such as the age of their fleet or just general negative sentiment around the airline sector.

Meanwhile, punters on Interactive Investor were more sanguine. The consensus here seemed to be that the size of the drop was unwarranted and that the drop presented a good buying opportunity.

I broke my own investment rules by impulsively stocking up my real life portfolio at 187p. The size of the drop seemed out of all proportion to the seriousness of the news. I reckon a lot of stops got hit, triggering a mini-collapse. I sniffed a buying opportunity and since I had a bit of cash sitting in my SIPP and so I thought, what the hell...

My Take on Dart Group


Although I don’t usually follow the stories behind individual stocks too closely, Dart has been an exception. This is possibly because it piqued my interest well before I adopted my current position of strategic ignorance. So here is my take on Dart.

Having old, cheap planes is actually central to Dart’s business strategy. Since their business is very seasonal, they wouldn’t be able to generate a sufficient return on capital from new planes. However, older planes don’t need to be constantly in the air to be profitable and it is easy to schedule maintenance during the off-season. It seems to me a business model that is fundamentally sound and the number of comments about the age of their fleet probably explains why Dart’s value rank is so high.

Lackluster performance across the board


Anyway, I digress. Five other stocks dropped by more than 5 per cent (Matchtech, Lookers, Fairpoint, Pace, Harvey Nash). Indeed, only 3 out of 15 stocks actually rose (RM, Cohort and VP). Ouch!

However, I maintain that this is a blip and that the portfolio has just been a little unlucky. I say this because my real life portfolio held up fairly well during June and was down by less than half a per cent. This was mainly because I hold a good chunk of Kentz, which surged almost 30 per cent during June. Slight differences in timing meant that it never made it into the MB portfolio even though the selection criteria were exactly the same. I also hold Trifast for similar reasons, which was up about 10 per cent over the month.

So it seems that luck can have quite an impact on the short term. The MB portfolio probably had a run of good luck last year and is having a run of bad luck now. However, luck is not a significant factor over the long term and a sound investment strategy should always outperform.

Tuesday 3 June 2014

Looking in the Rear View Mirror

Learning from mistakes

Investors naturally tend to focus on their current holdings and how they are performing. Decisions about whether to buy, add, hold, or sell are weighed up and decisions reached. As time goes by these decisions are vindicated, or otherwise. Wise investors reflect and learn from their mistakes and refine their strategies to avoid repeating them.

Keeping an eye on previous holdings

While this kind of advice is often heard, not many commentators cast a backward look in their rear view mirror and systematically write about what they have sold and then reflect on whether they made the right call. One welcome exception is this very honest post from Mark Carter.

I think that this general lack of interest in previously held stocks is just part of human nature. Once we no longer have a direct stake in something, it is natural that we should lose interest and redirect our energy into our current holdings and the next crop of potential buys.

However, it seems to me that a retrospective analysis of what we sell is just as important as what we buy. Indeed, for any type of trading strategy, if what we buy does not go on to outperform what we sold to fund our purchase, what was the point in selling?

A retrospective of sold stocks

With this is mind, I have done just such as review of the first year of the Mechanical Bull portfolio. Sixteen stocks were sold and replaced by sixteen others during the year. Stock rotation is a fundamental design principle of the Mechanical Bull approach, but this was slightly higher than I was expecting.

This may have been because in setting up the portfolio initially, the methodology was picking up a couple of stocks with lower scores then what generally occurs once the portfolio enters a more mature phase. There were five stocks in the original portfolio that had scores of 102 (all now sold). Typically, new entrants score 103 or higher so all other things being equal there should be less rotation over the next twelve months.

Some stocks were both bought and sold during the period, so tracking relative performance gets quite messy. So, for simplicity's sake I have compared the performance of the original 15 stocks over the last year with the performance achieved by the MB portfolio. This will provide an indication of whether all this rotation has been worthwhile. The results are shown below:

Table 1: Annual Performance of the ‘Original 15’ Mechanical Bull stocks to 24 May 2014:


This shows that the portfolio would have returned 37.1 per cent compared with 42.6 per cent achieved with rotation. Although rotation did deliver slightly better results, this is hardly a ringing endorsement. The MB strategy does take account of spreads and trading costs, but one would hope for a bit more return for all that activity.


A new rotation strategy?

The MB portfolio requires some form of rotation. Stocks are constantly moving in and out of the zone of interest. Therefore there is a balance needed between staying in the zone and a sensible number of trades. I am not convinced that I quite have got it right.

One idea I am toying with is to refocus the rotation strategy towards a ‘buy’ trigger. Currently, I focus on when a stock drops below my MB score of 90. This becomes a sell trigger with the proceeds being rotated into the highest scoring stock not already in the portfolio.

An alternative might be to focus more on when a new stock appears within say the top five of all stocks. This would act as the buy trigger, which would be funded by selling the lowest scoring stock. This could help enforce better quality buys and also be a way of minimizing unnecessary rotation. I may go back through my spreadsheets and do some backtesting of this idea.

In any case, whatever happens I will keep on keeping one eye on my rear view mirror.

Monday 26 May 2014

First Birthday Celebrations for the Mechanical Bull


A First Birthday

On 24 May 2013, the Mechanical Bull portfolio was born. It wasn't called that in the beginning. It was just an idea that I had been thinking about for a while before I decided to put into action. I invested a hypothetical £30K to see where it would lead. It was a couple of months later when I gave it the present moniker.

So where are we a year later? Well according to stock prices on Google Finance, the MB portfolio is £42,779, which is an annual gain of 42.6 per cent. While this may seem impressive, it is important to see performance in perspective.

Comparative Analysis

First, we should look at the broader market. The FTSE 100 has been pretty flat over the past year. The FTSE 250 has done somewhat better overall with a rise of about 9 per cent, although it was up by a lot more earlier in 2014 with a big pull back in the last few months.

It is also useful to compare performance against other investment strategies. Stockopedia's "Screen of screens" gained by 25.6 per cent

The MB portfolio would have come 7th equal out of Stockopedia's 65 guru (long) strategies. However, three of those ahead have two or fewer stocks, and so the MB portfolio would have faired even better if these non-diversified strategies were excluded.

Although the MB portfolio has gone sideways for the past 3 months, it has actually held up quite well compared to other strategies and the broader market. Indeed, the MB strategy outperformed all these comparators on 3 month, 6 month and 1 year timescales as this table shows:

    Table 1: Portfolio performance up to 25 May 2014


It's Not All Good News

It all seems pretty positive so far. However, a closer look at the current state of the portfolio reveals some concerns (Table 2)

     Table 2: Mechanical Bull Portfolio - Full History


Three stocks in the original portfolio remain (Dart, Matchtech, and Staffline). All three have seen strong gains with Staffline more than doubling in value. Of those stocks that were sold, only 3 out of 16 have been sold at a loss. Fyffes was the stand out with a 80 per cent gain.

Looking at the new entries shows a rather less satisfactory picture. Indeed, this year's new entries have been pretty dire, with all of them declining in value. This is a concern and gives pause for thought. This shows that the MB portfolio has held up this year mainly due to the robust performance of a small number of long serving, well performing (and thus over-weighted) stocks.

Topsy Turvy Market

As I mentioned in my previous post there appears to be something rather odd going on in the markets in recent months, with no investment style showing any real strength. Stockopedia's analysis of investment styles (e.g. quality, growth, momentum) shows that these have all underperformed the FTSE 100 over the past three months. Value and income styles are the only ones that have managed to keep up (just!). It is extraordinary to see that the second best performing Stockopedia guru strategy over the past three months has been James Montier's Trinity of Risk. This is a short strategy whose performance is going in completely the  wrong direction. It's all very topsy turvy.

It is not very clear what is going on. One theory is that the mid-cap stocks have had such a strong run over the past couple of years that investors are looking for any excuse to sell. Whatever is happening I am fairly certain that sentiment is overriding consideration of fundamentals. In any case, as long as no investment style is doing well, then the MB portfolio is always going to struggle.

Conclusion

Overall, I am satisfied with how the last year has gone. I remain convinced there is something in this approach. There is powerful rationale in investing in stocks with all round strengths and this has been reflected in a very good return over the past year.

However, this experiment is a good reminder that progress is not a straight line and there will be times where a strategy doesn't seem to work. One has to remember that markets always revert at which point the benefits of this strategy should start to kick in again.

Tuesday 29 April 2014

Has the Mo' Train derailed?

Momentum not doing well in recent months


Momentum is an important ingredient of the Mechanical Bull strategy. Along with value and quality it is a key set of factors that underpin Stockopedia's StockRanks. Also, 9 out of Stockopedia's 65 Guru screens are classed as momentum strategies.

These strategies have not done well in recent months. Over the last 3 months only 3 out of these 9 strategies have made gains compared with a 3 per cent rise in the FTSE All Share. Over the last month, they have performed even worse. Only one strategy showed a gain compared with a 1.7 per cent increase for the FTSE All Share.

Doing better over the longer term


The longer term picture looks much better. Over the last year, all 9 momentum strategies have trumped the FTSE All Share. This suggests that momentum strategies are effective over the longer term but that there are periods, such as now, when they will underperform.

I am fairly certain that the derailing of the Mo' Train is the most important factor in explaining the poor performance of the Mechanical Bull portfolio over the last few months. It is down 0.8 per cent over the past month compared to a 1.7 per cent gain for the FTSE All Share.

Lack of any current investment trends


Looking at the performance of Stockopedia's GuruScreen Composite Performance over the past month, momentum strategies are down a dismal 4 per cent. However, it is interesting to see that the FTSE 100 actually beats all other composite strategies during April apart from "value" strategies, which did only slightly better.

This suggests something rather odd is going on with share price movements becoming detached from any underlying investment trends. One possibility is that the very strong performance of these guru screens since the middle of last year has led the markets to look for a reason to cement these gains. The current crisis in the Ukraine might just be such a reason.

The Return of the Mo' Train


So what now for the Mechnical Bull strategy? Although its been two pretty disappointing months in a row, I remain confident in the basic concept. Indeed, what these last few months have shows is that things could easily have been even worse. There is an increased risk when following a single set of investment factors but this can be reduced by combining set of factors.

The Mo' Train may have derailed for a short time but I am confident it will come back on track at some point. Next month will be the one year anniversary since my launch of the Mechanical Bull portfolio. Let's see whether it can end the year on a high.

Thursday 3 April 2014

Sweett and Sour

Sweett crashes 25 per cent


Yesterday, Sweett (CSG) dropped by over 25 per cent (to 36p) following an announcement that the company was launching an investigation into allegations that former employees were involved in "material deception".

As hard as one may try to remain emotionally detached in such situations, its difficult to avoid that sinking feeling. As well as being one of the 15 stocks in the Mechanical Bull (MB) portfolio, I had around £4000 worth of stock in real life, which is now worth less than £3000. This has turned a lackluster month or so into one I would like to forget.

Second Thoughts


Further, as someone who has recently embraced strategic ignorance, one can't help starting to have second thoughts.

But the question is, would due diligence have made any difference? As someone who is no expert in due diligence, I am not really able to make that call, but I decided to have a bit of dig and see what others have been saying.

No Red Flags Spotted


A quick search on Stockopedia, found none other than Paul Scott informing us that he was dumping Sweett as it was now "uninvestable". He argued that they are a small company and could easily get wiped out.

Despite the negative prognosis, I immediately felt much better. If the master of spotting 'red flags' didn't see this coming, then what chance did I have?

Back in December last year, I see Paul Scott did have some major concerns around the presentation of their results. In fact he initially slated the company for what he took to be a lack of  clarity. However, he later moderated his stance following a conversation with a company advisor. He concluded by saying:

Overall I'm reasonably happy with those shares now. The true underlying EPS forecast for this year (ignoring the one-off derivative gain) is 4.8p. Therefore at about 62p the shares look sensibly priced to me, at a PER of just under 13. 

But in any case, the initial concerns raised by Mr Scott had  nothing to do with yesterday's dramatic fall.

Brokers and Boards


Yesterday, Westhouse Securities reiterated their buy rating (target 91p) although I assume they didn't factor in the events that were announced the same day.

Meanwhile, over on the iii boards, the sentiment was generally sanguine and the consensus was that they would bounce back. One person even claimed this was a good buying opportunity. While I don't stake too much on what is said on these boards, there was no one saying "I told you so", which is the most common refrain when things turn sour.

At the close of play today Sweett bounced back by around 8 per cent.

Standing Firm


In conclusion, I reckon that no one saw this going and any due diligence on my behalf wouldn't have made a blind bit of difference. This is just one of these things. Paul Scott may well be right, but the Mechanical Bull will stand firm. The MB numbers will tell me when to sell-up not movements in the share price.

Tuesday 1 April 2014

Mechanical Bull Portfolio - March Review

Summary

The Mechanical Bull (MB) portfolio was down by 1.4 per cent in March compared with a 3.1 per cent drop for the FTSE 100. So not a stellar month by any means. The biggest gain (by far) was Fyffes (FFY) with a 48 per cent rise. Cohort (CHRT) was the worst performing dropping by 18 per cent. Keller (KLR) was dropped from the portfolio (booking a small profit) to be replaced by Lookers (LOOK).


Comparison with Stockopedia's Screen of Screens

While pondering this month's rather lacklustre performance, it crossed my mind to check up on how Stockopedia's "Screen of Screens" (SoS) was faring. After all, the MB is a hybrid between this screen and their Stockranks index. As it turns out, the SoS performed even worse, down by 3.5 per cent in March.

So this got me thinking  about the relative performance of the MB portfolio and the SoS since the beginning of this experiment. It is perhaps surprising that I haven't thought to do this earlier since to the basic challenge I've set myself is to see whether I can improve upon Stockopedia's SoS.

As I have argued before there is a simple and powerful logic to the premise that if there is any predicative power at all with screening, then the SoS should tend out perform others. However, combining this screen with the Stockranks index should provide additional value, by highlighting stocks with even better allround strengths.


Preparing the Analysis

Before I show the results of this comparison, I just want to talk briefly about how put this analysis together. It took me a while to figure out exactly how to do it, but I eventually worked out how to scrape both the Stockopedia website for the SoS data and Google to scrape the equivalent data for the MB portfolio. Stockopedia is mostly very good, but I find the charting functions for custom portfolios don't quite cut it and so I keep a replica of my MB portfolio in Google Finance for these purposes. Anyway, after a bit of fiddling about, here are the results:


Mechanical Bull vs Stockpedia's Screen of Screens (May 2013 to March 2014)


The results seem quite persuasive. The MB portfolio held a narrow lead for the first five months or so but then started to pull ahead towards the end of the year and into 2014. To illustrate this more clearly, I have added another data series, namely the the extent to which the MB has outperformed the SoS.


Everything is relative.

After a rather disappointing month, it is good to be see things in perspective. The MB portfolio has clearly held up rather better over the past few months than the SoS. As I try to keep reminding myself, everything is relative. As long as I can stay ahead of my benchmarks, then the long-term returns should take care of themselves.


Tuesday 11 March 2014

When to sell?

Fyffes leaps 40%

Shareholders in Irish fuit company Fyffes will be wearing banana shaped smiles with yesterday's announcement of a merger with Chiquita to create the world's largest banana company. The share price jumped 40% on the news.

Writing about Individual Stocks

As a mechanical investor I don't try to analyse a stock and decide whether or not to invest. No doubt there are people who think this is crazy. Well they can think what ever they like - its my money after all.

For me the main downside is that as a blogger my approach of strategic ignorance makes it difficult to write about individual stocks and what specifically makes them a good pick.

A Screaming Buy

What I can say is that the MB method picked out this stock as a screaming by right at the beginning of this experiment about 8 and a half months ago. The Composite Rank score (an earlier variant of Stockopedia's Stockrank) had a score of 99 while putting in appearances in 7 their screening strategies.

Why makes things so complicated, when such a simple approach seems to deliver the goods? I'm now up 80% in this stock in less than a year. That's good enough for me.

I now know when to buy, but when to sell?

I am convinced more than ever that I have a reliable method for picking stocks that will outperform the market. Where I am less certain is about whether I have quite got it right in terms of when to sell. Fyffes now has a score of 92, which brings close to the point at which initially I would have expected it to be close to selling.

However, a couple of my initial picks (WH Smith & CSR) I have sold only for the stock price to keep moving higher. WH Smith has ben especially perplexing as the MB score dropped and then rebounded, along with the share price. Perhaps I need to lower the sell trigger?

This is something I will revisit as the strategy matures. I will run some simulations to test different sell triggers. I will also track the performance of my sells along with those that replaced them.

Ticker Name Mkt Cap £m # Screens (Long) Composite Rank MB score
DTG Dart 273.3 7 99 106
FFY Fyffes 169.5 7 99 106
CSR CSR 915.9 7 99 106
STAF Staffline 101.7 6 98 104
CRE Creston 55.6 6 98 104
SMWH WH Smith 970.1 5 99 104
MTW Mattioli Woods 52.7 4 99 103
KLR Keller 623.1 4 99 103
CPS CPL Resources 129.4 4 99 103
PHTM Photo-Me International 291.4 4 98 102
SPRP Sprue Aegis 35.1 2 100 102
MCRO Micro Focus International 1,043 3 99 102
SVS Savills 765.5 3 99 102
ADN Aberdeen Asset Management 5,692 4 98 102
MTEC Matchtech 78.5 2 99 101


Saturday 15 February 2014

Using a Monte Carlo Simulation to Measure Portfolio Performance

Clever or Lucky?

As I mentioned in last week's post, I am interested in the question as to whether the impressive performance of the Mechanical Bull (MB) portfolio is the result of a clever investment technique or whether I have simply been lucky. In this post I have done some analysis to try and answer that question using a Monte Carlo simulation.

Wikipedia describes Monte Carlo methods as:

"... a broad class of computational algorithms that rely on repeated random sampling to obtain numerical results; typically one runs simulations many times over in order to obtain the distribution of an unknown probabilistic entity"

This technique can be applied to answer my question. The idea is to take the full set of stocks from my investment universe, select a corresponding time frame, create portfolios at random, and then calculate an average return for each portfolio. The full set of returns then provides a distribution against which the performance of the MB portfolio can be measured. This can be used to tell me whether I am clever or just lucky.

Backtesting data

To do this experiment I needed a backtesting database. I used Sharelockholmes, for no other reason then I have used it extensively in the past and the cost of renewing my subscription was affordable (£5.20 a month). There may be better such databases out there, but I did not bother to investigate this further.

Sharelockholmes allows you to select a point in time at each quarter and then see how selected UK stocks would have performed over selected future time periods. Since I started the MB portfolio on 24 May 2013, I could not test its performance from the outset. The best I could do was to start from 30 June. Likewise, the way subsequent performance is reported is constrained and so the testing period stops at 31 December. This gave a total test period of six months. The MB return over this period was 31.6 per cent.

Issues to sort out

A common issue with backtesting is company delisting, which for Stockopedia means that the forward performance metrics are missing. There were 43 such stocks in my dataset. I tackled this by searching each of these stocks manually and then identifying the last price at which the stock traded. In some cases this might not have reflected reality, for example, if the stock was suspended and shareholders were later wiped out. However, in one case (RSM Tenon) I remembered what happened so I recorded a nil return.

I also noticed some other problems with the performance mertics. For example, Ixico showed a 6 month performance gain of 4240 per cent! Some quick research revealed that the company has a reorganisation of share capital as the result of a reverse takeover, so these figures were not reliable. I readily concede that there may be other errors in the data and as such this experiment may not perfect. However, I simply did not have the time or patience to investigate these further.

Running the simulations

Once I had a full set of performance metrics, I generated portfolios based on a random selection of 15 stocks, which is the same number that I hold in my MB portfolio. I did this in Excel by adding a random number column in the spreadsheet, which I then sorted to generate a new portfolio and an average return metric for each. I repeated this 100 times thus providing 100 hypothetical return values.


The Results

The average return from each of these simulations was 9.4 per cent. This compares with the FTSE Allshare return of 9.7 per cent (sourced from Google Finance) over the same time period, so this seems about right. But the real point of doing all this was to get an estimate of variance, or the degree to which the simulations vary around this average. Now clearly, the MB return of 31.6 per cent is much better than 9.4 per cent, but how can I be sure that this is not just down to luck? The higher the variance, the more difficult it is for me to claim to be clever rather than lucky.

The standard deviation is a useful measure of variance as this can be used to construct confidence intervals, which are a commonly used framework for hypothesis testing, For the data I generated the standard deviation was 10.4 per cent. I am not going to do all the maths, but in lay person's terms this all means that we can be 95 per cent confident that the out performance of the MB portfolio over this period was due to something other than luck.

It is important to note that this test does not say anything about the level of out performance. All this is saying is that the MB portfolio is very likely able to deliver out performance. So with a 31.6 per cent return over this period, perhaps I have been both clever and lucky!


Saturday 8 February 2014

Mechanical Bull Portfolio February Update

It has been almost two months since my last update so apologies for that. I have been very busy with other things, so just as well the MB strategy doesn't require much investment in time!

There were two drop-outs in December, with Creston & Terrace Hill Group meeting the sell rules. These were replaced by Sweett and Renew. The latter is already up by over 20 per cent in less than two months. Sweett was up over 15 per cent  at one point but dropped right back. In January Micro Focus International was replaced by VP, which hasn't done much as yet.

Overall the portfolio continues to increase in value at a blistering pace, up almost 37 per cent since May 2013. This is an annualised rate of over 50 per cent.

One of the things I would like to explore further is the extent to which this kind of out-performance could be down to chance, or whether this strategy will always tend to out-perform. I suspect it is latter, but what level of out-performance would be "par"?

The general area of statistics dealing with such questions in known as Monte Carlo simulations. These do not seem to be written about that much within the blogosphere or popular literature. However they seems to me to be of fundamental importance when evaluating the effectiveness of different investing strategies. It really grates when I read about someone's portfolio being up x per cent over the year, when in fact, the benchmark index is up by a similar amount. I would be more impressed with an approach that delivered zero returns against a sharp drop in the index. Context is everything.

This is something I might try to write more about further in a future post.